12:53 pm
October 9, 2025
The solution to the budget problem this year included about $7 billion in savings items over the outlook period. The savings items include some real program reductions, but they also include shifts to other funds or user fees and general efficiency savings, for example.
Given the unsustainable nature of the enacted budget and the subsequent reductions to the revenue forecast, the Legislature faces another major shortfall in 2026. Legislators will need to consider additional spending reductions.
Of the $7 billion in savings, $3.1 billion was to 2025–27 appropriations. Nevertheless, 2025–27 appropriations from funds subject to the outlook (NGFO) are $77.858 billion, which is $5.913 billion (8.2%) higher than the appropriations level in the 2024 supplemental budget. Over the 2021–2024 period, the Legislature added $13.874 billion in net new policy spending.
Before the budget was enacted this year, we suggested that the Legislature forgo new spending, roll back programs started in recent years, and consider cutting long-time programs if they are no longer priorities.
But what are we spending on long-time programs?
Washington has a very good fiscal data website. However, there is a major hole that I think can only be fixed by the Legislature. Currently, historical state spending data shows total spending by agency and spending by broad program areas within an agency. For example, spending areas for the Office of the Governor are executive operations, mansion maintenance, family and children ombudsman, education ombudsman, and corrections ombudsman’s office. There are many different policies and programs combined in those broad categories.
Additionally, for the current budget, you can see the carry-forward level and changes the Legislature made to an agency’s previous appropriations:
- Carry-forward level (CFL): The CFL moves current funding into the next biennium, after removing one-time spending items. There is no information shown about which programs are included in the CFL, or how much they cost individually. This is a black box.
- Maintenance level (ML): This adjusts the CFL to reflect changes to caseload, enrollment, and inflation. Effectively, the ML comprises the CFL plus the maintenance level change. The ML changes are shown along with amounts, but there is no information about the total underlying costs of programs.
- Policy level (PL): This is new spending additions or reductions. The changes are listed along with amounts, but again there is no information about any underlying costs of existing programs.
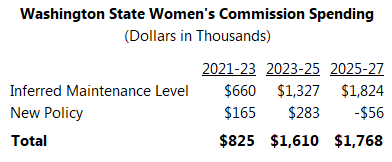
To return to the Office of the Governor example, consider the case of the Washington State Women’s Commission. It was established in the Office of the Governor by HB 2759 in 2018. The 2018 supplemental budget included $291,000 to implement the bill. At that point, the Women’s Commission disappeared into the CFL (and it is not a separate category in the historical spending for the Office of the Governor). Policy changes were made to the Women’s Commission in 2022, 2024, and 2025. Now, the Office of the Governor’s 2026 supplemental budget request includes $142,000 for an executive assistant for the Women’s Commission. The request helpfully includes historical funding for the Women’s Commission going back to 2022. In the table below, I show the new policy changes for the commission that have shown up in the budget data, and I estimate the maintenance level given the total funding from the budget request.
The Women’s Commission is a good example of the budget data problem because it shows how new policy becomes the maintenance level and then continues to grow in the dark. It also shows how specific programs get lost in overall agency budget data. The Women’s Commission and countless other programs are almost completely invisible in the budget data—until the Legislature decides to increase or decrease their funding.
Given this opacity, there is no way for the public to make measured, specific recommendations about which programs should be cut. What other programs were started years ago and are just carried forward and grown in every budget on autopilot?
Further, even when it is obvious in the data that a program exists, the budget data is often not specific enough to meaningfully assist policymakers and the public in assessing budget tradeoffs. A good example here is Medicaid.
Medicaid is a joint program of the federal and state government. Within the program, various populations and benefits are either mandatory or optional. There is no way to see the total amount Washington spends on Medicaid in the historical budget data. Similarly, for the current budget, you can see the amount of federal funds appropriated for Medicaid, but not the state funds appropriated for Medicaid.
The HCA is required to make quarterly, detailed Medicaid spending reports to the federal government. Although the federal government makes those reports public, they are published in terms of the federal fiscal year (which begins Oct. 1). Thus, they are not helpful for considering costs to Washington state relative to other state spending in the state fiscal year (which begins July 1).
This summer I asked HCA for copies of the quarterly reports going back to 2000. In response, they sent me all the reports in a single pdf file that is 91,883 pages long. When I have a chance to compile the data in a more usable format, it should provide helpful information about the growth of Medicaid spending in Washington over time and how populations and benefits have changed.
But this is information that should be included in the state fiscal data. In 2020, we recommended that the state make Medicaid spending more transparent. As discussed above, the data problem isn’t unique to Medicaid. By listing the individual programs that make up the CFL and including all programs in the historical spending data, the state would vastly improve transparency and make it easier for policymakers and the public to prioritize state spending.
Categories: Budget.