11:32 am
July 22, 2026
The Joint Legislative-Executive Committee on Budget Transparency and Fiscal Sustainability—created in the 2026 supplemental budget—met for the first time on Monday. The state has contracted with Pew to support the committee and provide research on budget practices in Washington and other states.
The meeting included a good staff presentation on the budget, including discussions of spending drivers and the budget process. Then, Josh Goodman of Pew talked about Pew’s work on fiscal sustainability. Over the years, I have found Pew’s work on revenue volatility and reserves to be particularly useful. (Our new Fiscal Management Performance Review includes data from Pew on the days Washington could run on reserves, compared to other states.)
I wanted to make three points about the staff presentation. First, it includes this slide:
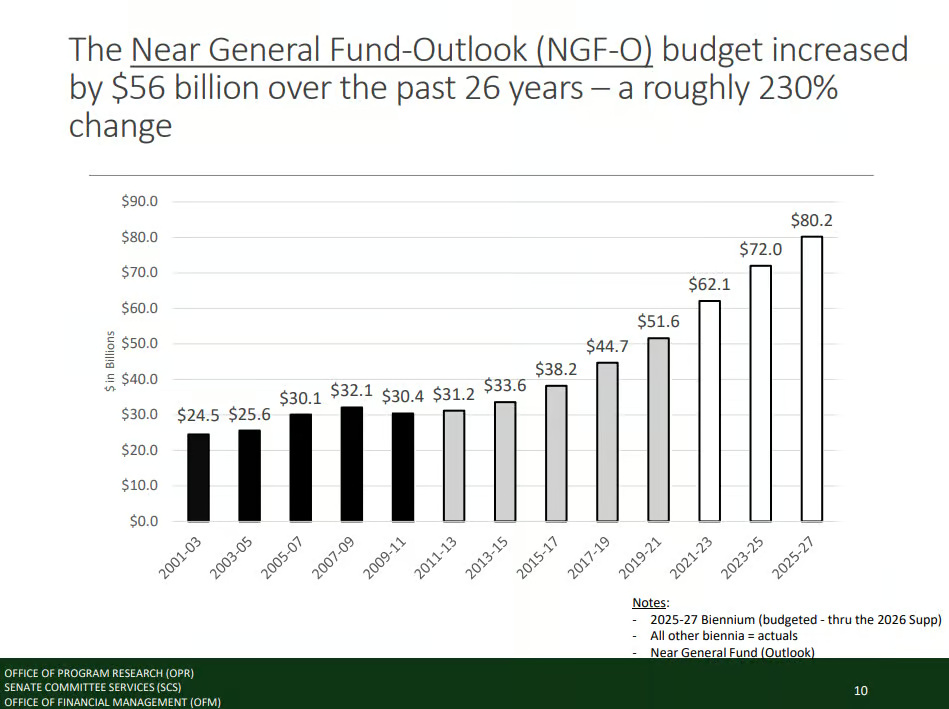
Staff did not explain the color coding, but it corresponds to three distinct budget eras. The black bars are the run-up to the Great Recession and the Great Recession itself, and the gray bars are the McCleary era. The white bars are the post-McCleary, post-pandemic era. This last is the era that is most relevant to our current budget problem. Since 2019–21, NGFO spending is up $28.608 billion (55%). (This includes actual spending for 2021–23 and 2023–25 and enacted appropriations for 2025–27, as revised in 2026.) The chart below shows how the increased spending was distributed among budget areas. (The staff presentation did this analysis—see slide 11—based on the spending change since 2001–03. Because that captures the McCleary era, the distribution is quite different.)

Second, slide 6 in the staff presentation shows spending by object. Employee salaries and benefits made up 20% of total operating spending in FY 2025. However, this understates the amount of state funding for compensation. The 65% of spending that goes to “grants, benefits, & client services” includes state funding for K–12 staff salaries and state funding for compensation for social service providers who bargain with the state. This is an example of the budget data transparency problem. There is no way to know how much of the grants are related to these compensation items that are directly paid by the state to non-employees. Further, note that the slide is in terms of all budgeted funds, which includes federal dollars. State budget data does not provide spending by object in terms of the NGFO.
Third, whenever there’s a budget shortfall, there’s always a question about how much of the budget is protected from cuts. Staff on Monday did a good job of explaining that there is a lot of gray area, and the outline on slide 9 shows that there is a continuum from mandatory to discretionary. However, as we wrote in 2020, “Although the items considered protected may be more difficult than others to cut, it is not the case that they can never be cut.” The Legislature can change state statutes, it can choose not to participate in federal programs, and it even has some leeway for spending that has constitutional restrictions. For example, the state Supreme Court has said that, even though basic education is constitutionally protected, it is not the case that the Legislature can never make changes to the program of basic education. Further, even if a service is considered protected, it may be the case that the service could be delivered in a more efficient way.
Thus, although the starting point for each budget is the maintenance level (the cost of continuing current services or services planned in statute, adjusted for inflation and caseload), it is not the case that nothing in the maintenance level can ever be cut.
Making budget data more transparent so that it is clear what programs are included in the maintenance level would help legislators prioritize spending. A program that made sense 20 years ago may no longer be a priority.
Categories: Budget.