12:34 pm
September 2, 2020
In response to the state Supreme Court’s McCleary decision, the Legislature increased state spending on public schools by 110.0 percent from 2009–11 to 2019–21. (Spending on all other programs increased by just 52.0 percent.) The increases in state spending have translated into higher per-pupil spending by school districts. The chart shows K–12 spending per FTE enrollment through SY 2018–19.

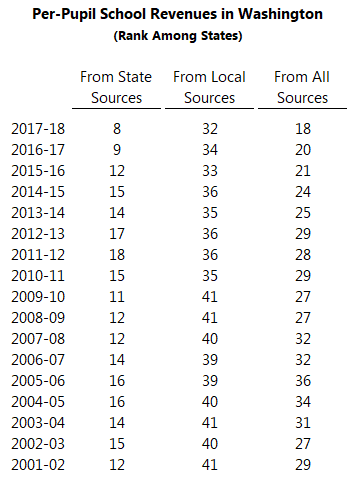
Further, the increases have been significant enough compared to other states to move Washington up in the national rankings of school spending and revenues per pupil.
The most recent year of data that is comparable nationally is school fiscal year 2018 (i.e., SY 2017–18). In SY 2017–18, according to the U.S. Census Bureau, Washington’s public schools spent $12,995 per student (above the national average of $12,612 per student). Spending per student increased by 37.0 percent over SY 2010–11—the highest percentage growth over the period in the country.
The table below shows how Washington’s rankings have changed for school revenues per pupil from state, local, and total sources. Washington has moved up in all three of these rankings in recent years.
It is important to remember that one of the last—and most expensive—pieces of the response to McCleary was increased school staff salaries. They were first fully funded in SY 2018–19. Given that, expect Washington’s school spending and revenue rankings to increase still further when SY 2018–19 data is reported next year.