2:50 pm
August 24, 2020
A previous blog post used a data set of real-time economic statistics compiled by Raj Chetty and his team at Opportunity Insights to break down Washington state consumer spending by industry. Chart 1 uses the same data set to track rates of consumer spending in Washington state ZIP codes with different median incomes. The vertical axis measures consumer spending rates relative to January baselines. The dark blue line represents the spending rates of consumers living in ZIP codes with middling median incomes, the light blue line represents the spending rates of consumers in the poorest ZIP codes, and the black line represents the spending rates of consumers in the wealthiest ZIP codes.
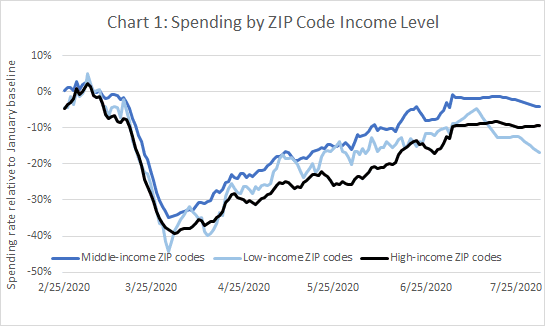
Three things stand out about the chart. First, spending rates in ZIP codes belonging to all three income levels plummeted in March before recovering over the next several months (though none have yet reached their January spending levels). This makes sense; the COVID-19 death rate in Washington state rose sharply beginning in March, making many purchases unsafe and creating uncertainty around household incomes and asset values.
Second, since late April the richest ZIP codes have spent the least of any ZIP code income category relative to their January spending rate, the poorest ZIP codes have spent the second least, and middle-income ZIP codes have spent the most.
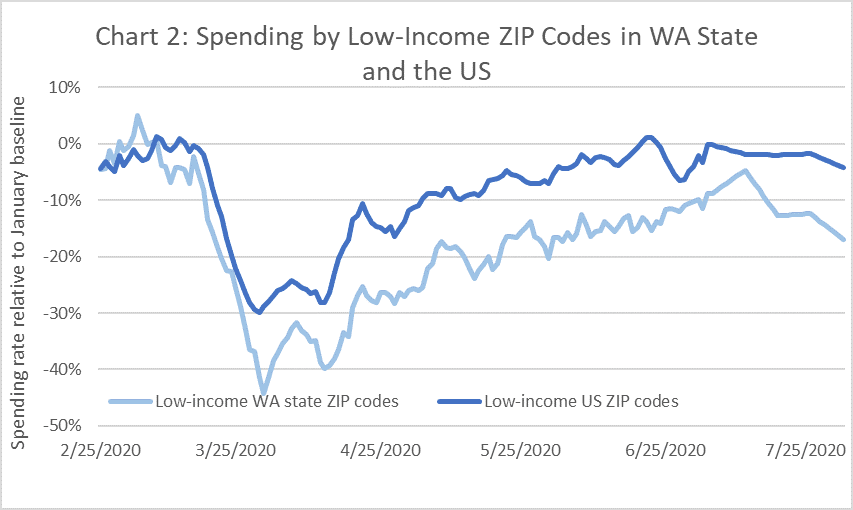
Third, spending rate patterns changed significantly in all three ZIP code categories beginning in July. The spending rates of middle and upper–income ZIP codes stopped increasing and leveled off starting in July, while the spending rates of low-income ZIP codes in Washington state stopped increasing and began decreasing significantly. However, as the dark blue line in Chart 2 shows, spending rates did not decrease very much nationally during July in low income ZIP codes. This suggests that one should look within Washington state specifically, not the US more broadly, for explanations underlying July’s downturn in low-income ZIP code spending at the state level. One such explanation within Washington state could be the increased prevalence of COVID-19 during July in particular regions outside of King County.
Regardless of their causes, the recent leveling off and decrease in Washington state spending will create problems for the state budget. This is because consumer spending drives state government revenue by contributing to sales tax revenue and increasing gross business profits, which in turn contributes to business and occupation tax revenue. Consequently, the fact that consumer spending increased in June before leveling off and decreasing in July means that the unexpectedly high tax revenue associated with June’s transactions might not persist into the future.
Daniel is a WRC intern.
Categories: Categories , Economy.