10:02 am
November 20, 2017
The League of Education Voters (LEV) ran an interesting item last month looking at the spending numbers in the education funding bill the Legislature passed this session (EHB 2242). It notes,
. . . it appears we are widening the financial gap between some local districts that historically have received more funding and those that have not. Under the new state law, every district will receive more state money than they currently receive. However, an analysis of expected district revenue illuminates a growing divide where many districts with high concentrations of historically underserved students will receive ‘less more money’ than their peers.
(Emphasis in original.)
The post includes a chart showing the expected growth in funding from SY 2016–17 to SY 2020–21 for 13 school districts around the state, and it compares the regionalization factor each district receives under the bill with each district’s free-reduced price lunch (FRL) enrollment.
The regionalization factor is the mechanism the Legislature adopted in EHB 2242 to account for economic differences between districts when determining salary allocations. It is based on median home prices in a school district and other districts within 15 miles, and it increases state salary allocations by 6, 12, or 18 percent (depending on how much higher district median home values are than the state’s median home value). The regionalization factor may be increased by the Legislature in the operating budget, but this additional factor must be reduced or eliminated by SY 2022–23. In 2017, the Legislature approved this additional factor for 27 districts, because their new salary allocations would have been less than their total salaries were in 2016–17.
I was curious about what happens for all the other districts in the state, so I pulled the data from OSPI’s multi-year budget comparison tool. Readers of the LEV post may come away with the impression that districts with lower rates of FRL are more likely to get the regionalization factor and are thereby more likely to see higher spending growth. It’s true that some districts fit this bill, but it’s not universally true. (Even among LEV’s sample, Tukwila and Highline have high FRL percentages and big increases in spending.)
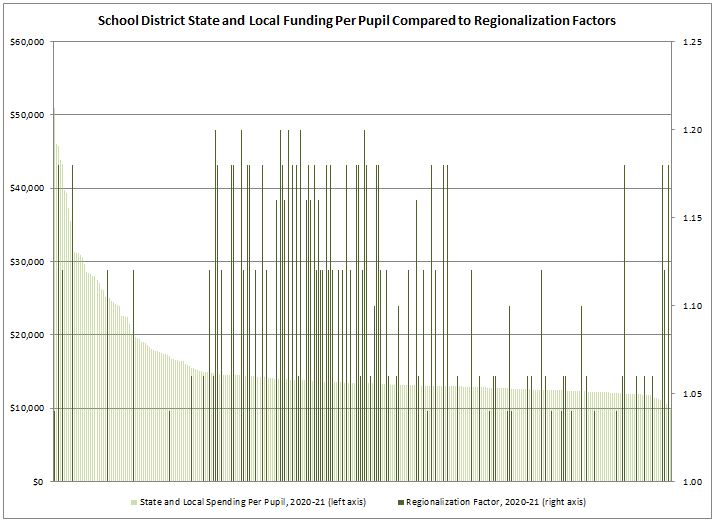
Many districts with high percentages of FRL enrollment get regionalization funding increases. That said, it does appear that regionalization increases are more concentrated in districts with smaller percentages of FRL.
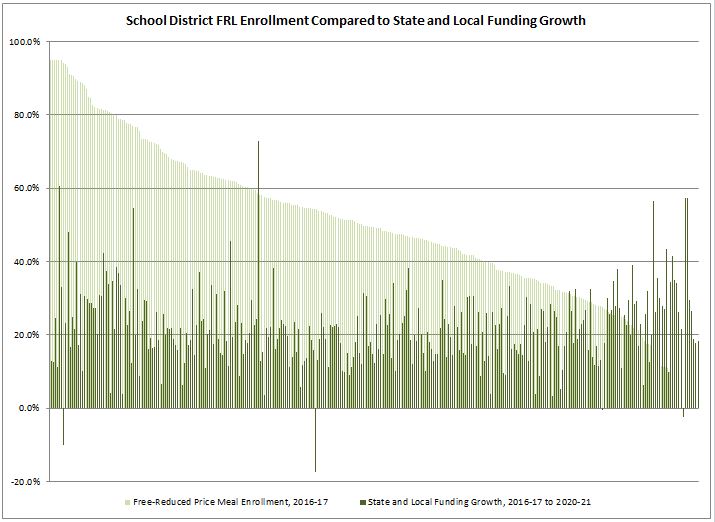
However, total (state and local) funding growth is fairly evenly spread among the districts.
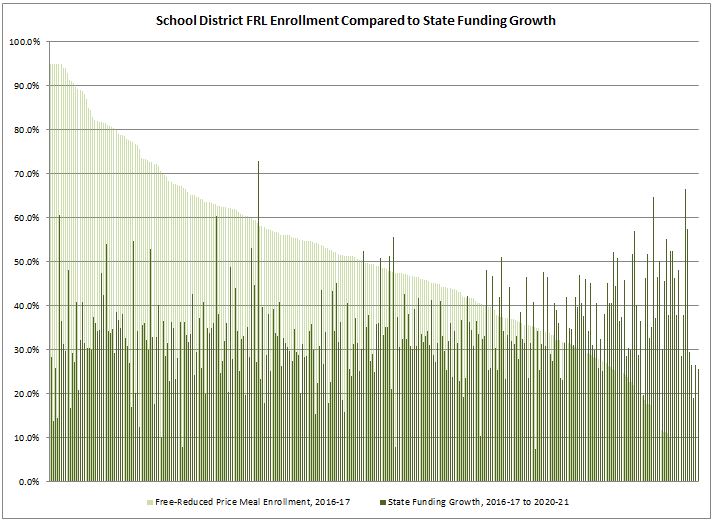
When you look at the growth of state funding alone, it does appear to be a little more likely that the higher spending increases go to districts with lower FRL enrollment.
Additionally, the regionalization factors do not necessarily lead to more per-pupil spending (especially when you look at state funding only, as in the second chart below).
To take a couple of examples from LEV’s sample: In 2020–21, per-pupil state funding will be $12,689 for Yakima (which has a high FRL rate and no regionalization factor) and only $11,543 for Lake Washington (which has a low FRL rate and gets an 18 percent regionalization factor). (When you add in potential local levy funds, Lake Washington’s total per-pupil funding moves ahead of Yakima’s.)
According to EHB 2242, the regionalization factor is the Legislature’s attempt to account for “regional differences in the cost of hiring staff.” In turn, it addresses the McCleary mandate that state allocations for salaries must meet “the actual cost of recruiting and retaining competent teachers, administrators, and staff.” To be sure, average salaries across all occupations vary across the state—they range from $30,839 in Okanogan County to $76,828 in King County.
As LEV suggests (and as Lori Taylor of Texas A&M told the Seattle Times in a July story), the regionalization factor may be a kind of feedback loop similar to the old staff mix system through which wealthier districts may get more state funding (driven by high home values rather than student need). But there are mitigating factors under the new bill. For example, it provides additional Learning Assistance Program funding for high poverty schools and local effort assistance will be provided for any district that does not generate at least $1,500 per student from an enrichment levy of $1.50 per $1,000 of assessed value.
I’ll leave the question of how equitable this is to others. But it’s important to remember that the Legislature has substantially increased funding for education over the past several years and per-pupil state funding is increasing for every district under the bill. Continued analysis of the bill’s impacts will be important. In the meantime, the state Supreme Court has given its blessing (aside from the phase-in of salary allocations, of course). As the Court wrote in its order last week, “At this point, the court is willing to allow the State’s program to operate and let experience be the judge of whether it proves adequate.”
Categories: Budget , Categories , Education.


