11:19 am
February 8, 2023
SSB 5082 would repeal the non-binding advisory votes on tax increases that have been on ballots since 2012. It would also require voters’ pamphlets to include a link to a website that provides specified budgetary information. This appears to be a nod to transparency and a sop to voters—who put the advisory votes in place (as part of I-960 in 2007).
However, how meaningful would the information at the website be? The bill would require the website to include:
- Summaries of the most recent adopted operating, capital, and transportation budgets (including describing major sources of revenue and categorizing the expenditures in decreasing order),
- Charts showing the funding sources for operating budget in the most recent biennium, and
- Tables showing state and local expenditures as a share of personal income for the past 20 years.
There would be no comparison of revenues over time. Moreover, looking at spending over time only as a share of personal income can be misleading.
There are two main ways to compare spending (and taxes) across time and states: as a share of personal income and per capita. The U.S. Census Bureau provides this data for the states (their most recent data is for 2020).
Chart 1 shows state and local spending as a share of personal income in Washington and in the U.S. It appears that Washington’s spending is lower than it was a decade ago, and we rank just 31st among the states. But this can be considered a measure of relative effort, not results. It does not mean that Washington is providing fewer services now.
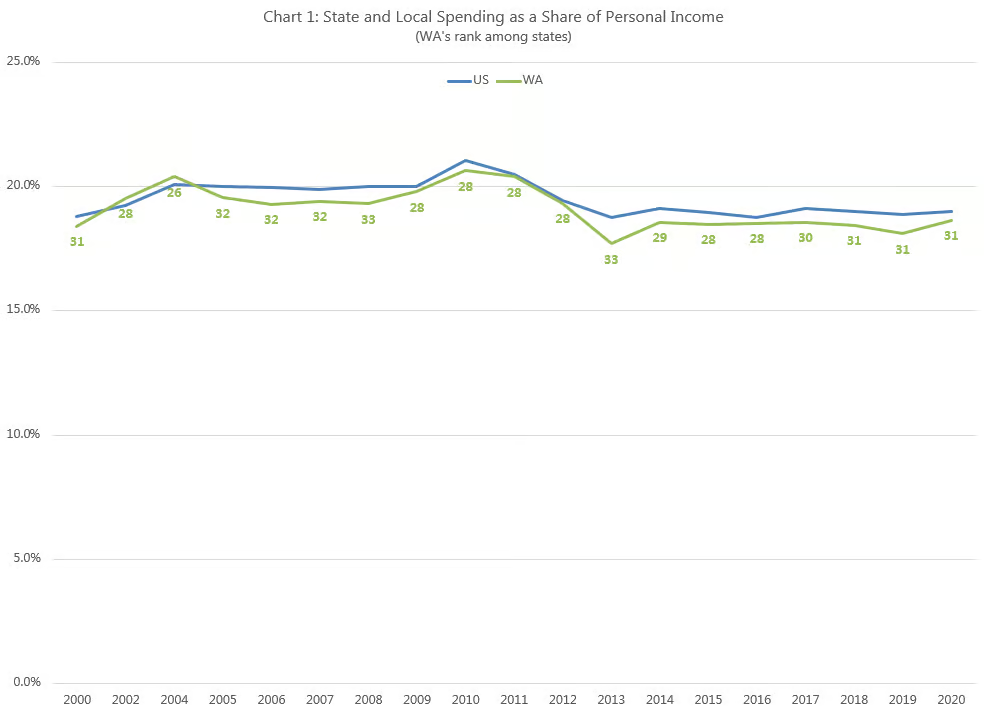
Washington is a wealthy state—personal income per capita here was the sixth highest in the country in 2020. This means that we can spend more per capita than many other states even as spending as a share of personal income remains steady or drops. In other words, for the same amount of effort, we are spending more per person. For example, in 2020, Washington’s state and local spending as a share of personal income was 18.6%, which translated to spending per capita of $11,589. North Carolina spent about the same as a share of personal income (18.7%), but it spent just $8,957 per capita. Mississippi spent much more than Washington as a share of personal income (23.8%) but spent just $9,364 per capita.
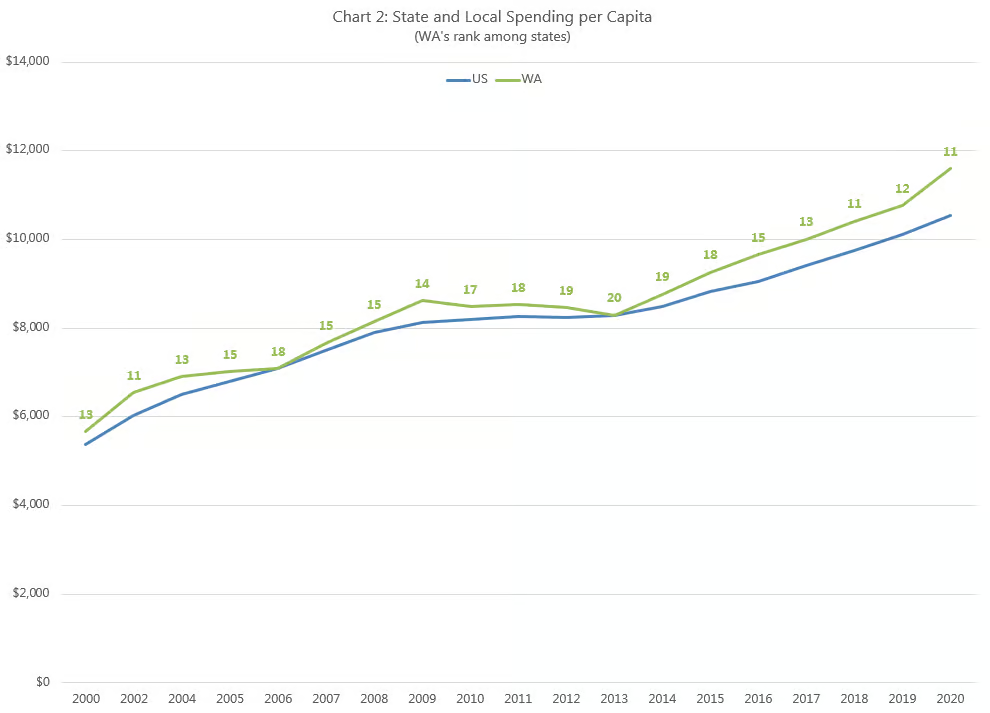
Chart 2 shows state and local spending per capita. Spending per capita in Washington has grown considerably over the last 20 years, and our spending ranks 11th highest among the states.
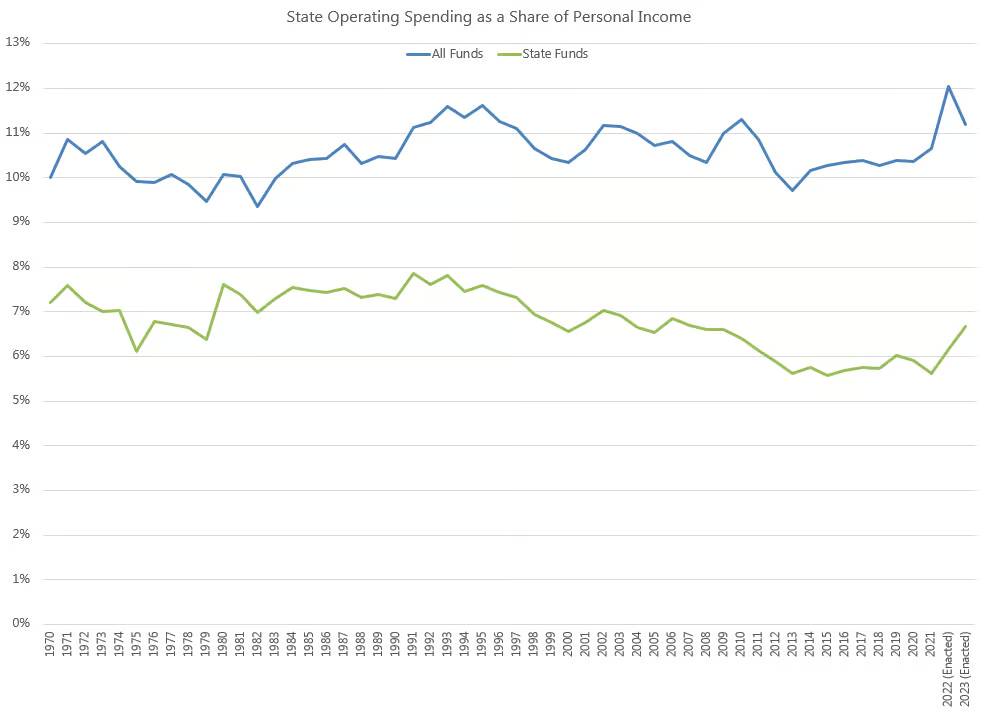
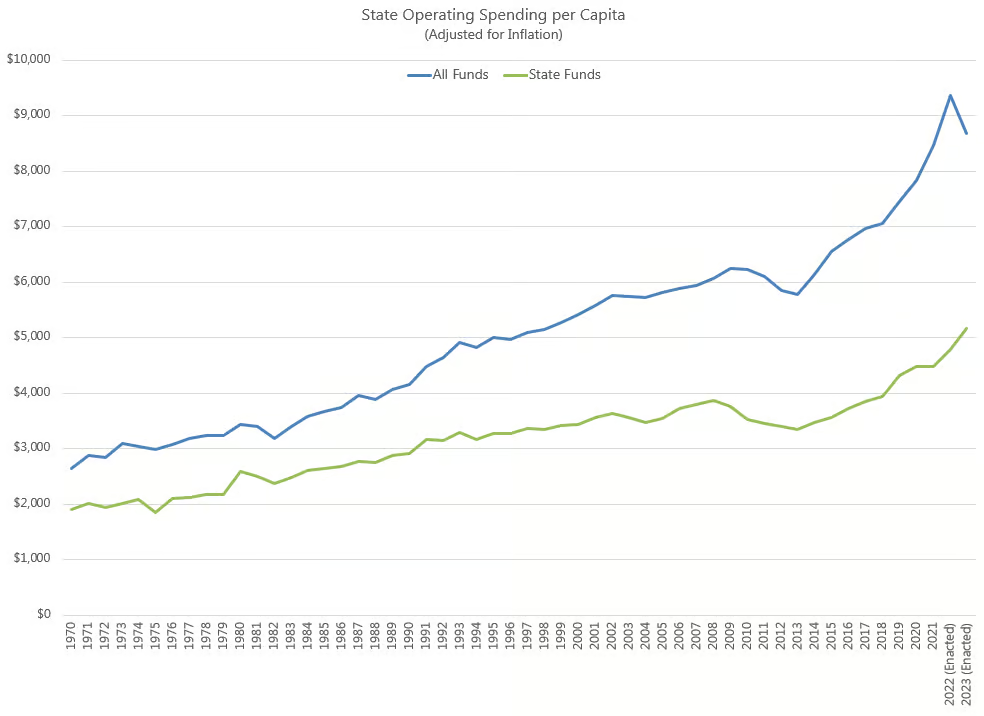
Note, too, that the state significantly increased spending in 2022 and 2023, which is not yet reflected in the Census numbers. The following charts show state operating spending from state funds and from all funds from 1970 to 2023, as a share of personal income and per capita. The same story holds: spending as a share of personal income is fairly steady as spending per capita (and adjusted for inflation) rises over time.
If legislators want the information provided in SSB 5082 to be meaningful for voters, the measure of spending over time should not be presented only in terms of personal income.
Categories: Budget , Tax Policy.