9:49 am
August 9, 2023
In June, the Seattle Times held a webinar on school finance. It prompted me to put together some education finance charts with background data.
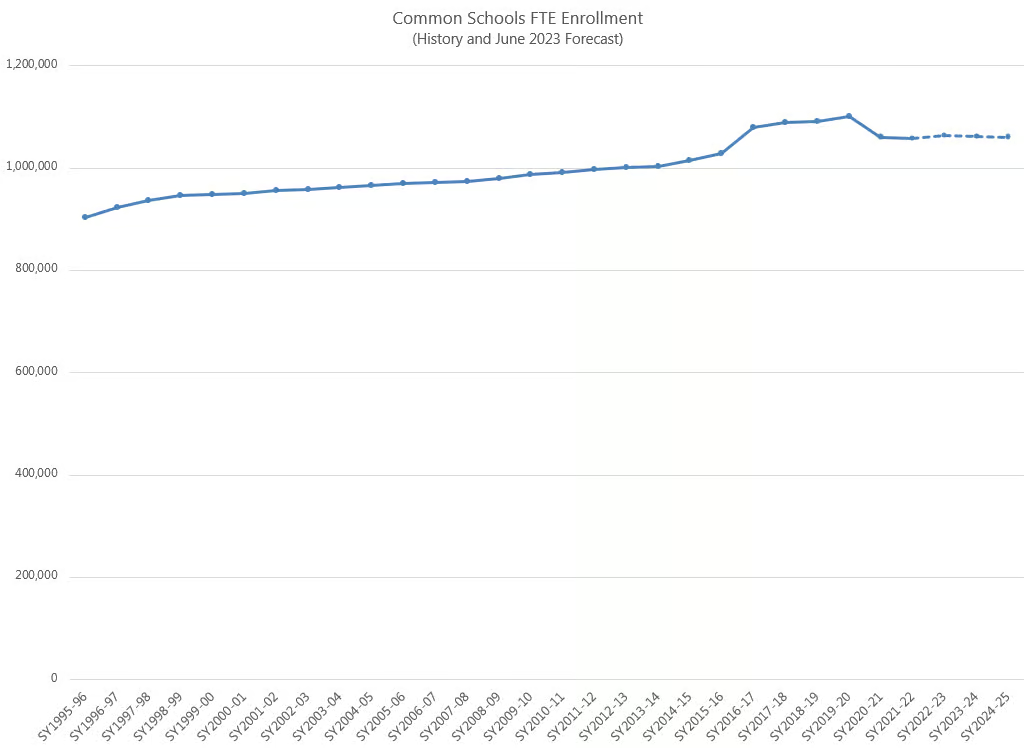
First, T.J. Kelly of the Office of Superintendent of Public Instruction noted that school enrollment has declined since the pandemic. Indeed, there was a substantial drop in school year (SY) 2020–21. The June 2023 caseload forecast estimates that school enrollment increased slightly in SY 2022–23 (but still well below SY 2019–20 levels) and will decrease over the next two years.
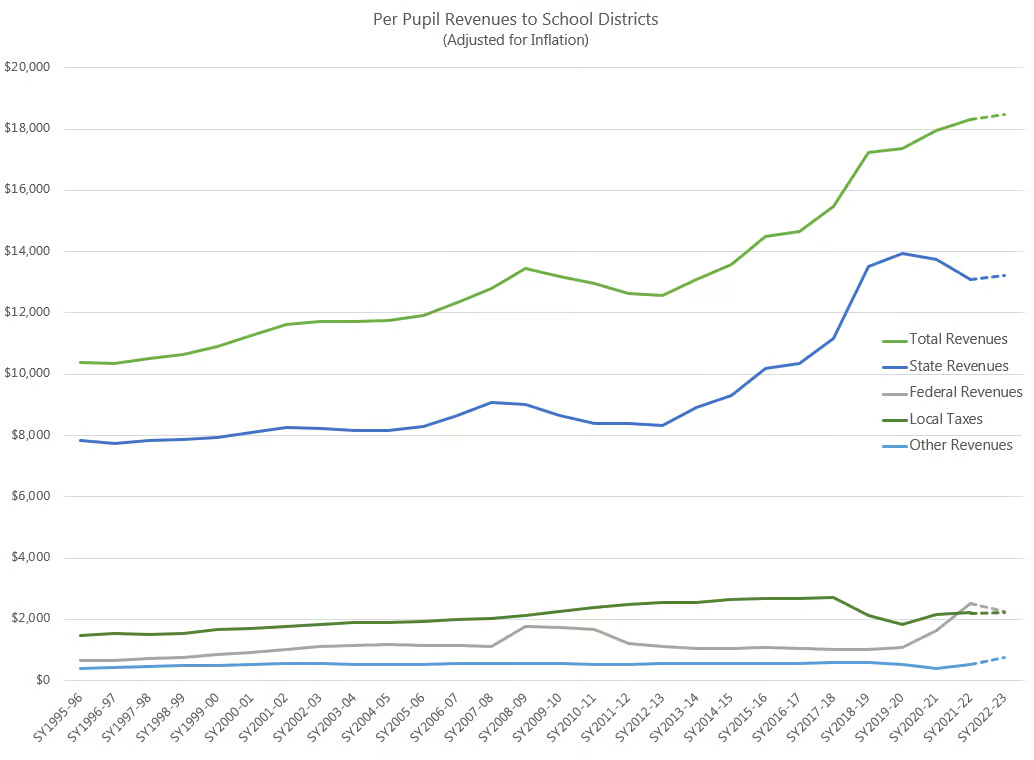
Despite the enrollment declines, school district revenues have increased. Total general fund revenues for schools (adjusted for inflation) increased by 2.8% from SY 2019–20 to SY 2022–23. Total general fund revenues per pupil (adjusted for inflation) increased 6.3% over the period. Both figures include revenues from state, local, and federal sources. The chart below shows how total, state, federal, and local revenues (per pupil and adjusted for inflation) have changed over time. (The drop in local taxes in SY 2018–19 was due to tax changes implemented as part of the McCleary decision, which we discussed in detail in this report.)
Finally, at one point during the webinar, JoLynn Berge of the Northshore School District said that the state “used to spend 50% of its general fund budget on education and that number has fallen to 42%. If that number had been maintained at 50% of the state budget, we would not be having a conversation about budget issues in schools.”
Setting aside the fact that “50% of the budget” is a moving target that has no connection to actual educational spending needs, it is not the case that the state has historically dedicated over half its budget to schools. State funding for K–12 exceeded 50% of the NGFO (funds subject to the outlook) budget in fiscal years 2019, 2020, and 2021. Under the 2023–25 state operating budget, K–12 spending accounts for 43.8% of NGFO spending in 2024 and 44.0% in 2025.
According to the Legislative Evaluation and Accountability Program (LEAP) Committee, on a biennial basis going back to 1981–83 (which is the earliest available data), K–12 spending as a share of the near general fund–total (the general fund and various related funds, which is the best way to compare biennia over a long time period) exceeded 50% only in 1981–83, 2017–19, and 2019–21. Nevertheless, state spending (adjusted for inflation) for K–12 has grown 232.6% since 1981–83. (Per pupil, adjusted for inflation state spending for K–12 has increased 121.7%.)
