2:30 pm
October 1, 2020
Here are updates (including just-released data for August) of two charts that I originally posted on September 12 regarding income and consumer spending during the Covid-19 recession.
On the first chart, the stacked columns show estimated personal income for the U.S. as a whole, by month, from January 2019 through August 2020. The numbers are seasonally adjusted annual rates. I have broken personal income into four parts: employee compensation (wages and salaries, and supplements); unemployment insurance benefits; other government social benefits (e.g., social security, Medicare and Medicaid); and other income (e.g. interest, dividends and profits of non-corporate business activities, including property rentals).
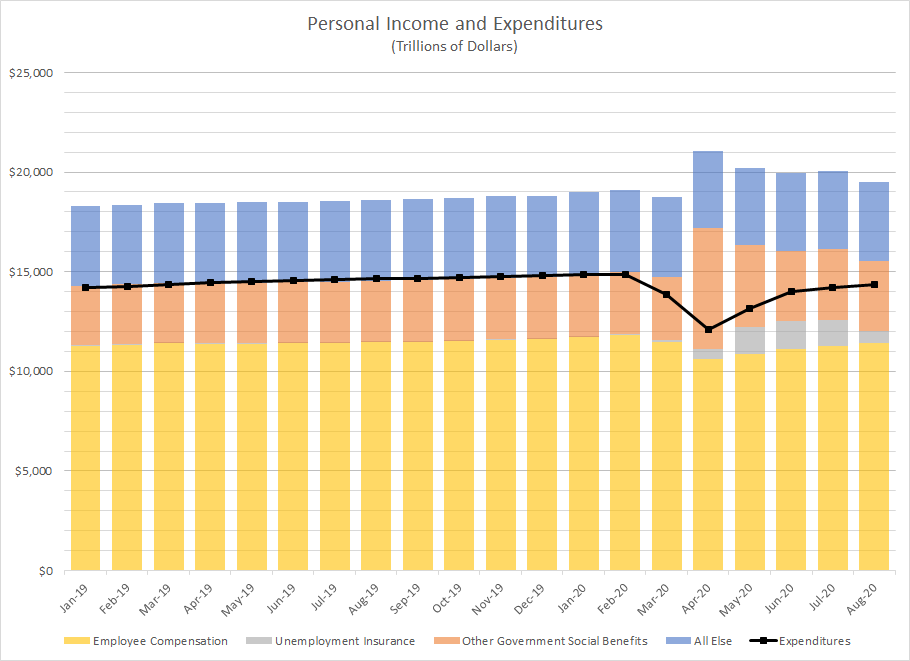
Personal income in August 2020 was 2.0 percent higher than in the preceding February (the last month before the Covid-19 recession began), but 2.7 percent lower than in July. The reason for the July to August decline is the expiration of the special $600 per week federal UI benefit at the end of July. Total government benefits in August were 30.5 percent greater than in February, but 15.0 percent lower than in July. Unemployment insurance payments in August were 50.0 percent lower than in July. Employee compensation in August was 3.6 percent lower than in February, but 1.2 percent greater than in July.
Also on the first chart, the black line shows monthly personal consumption expenditures. Again these numbers are seasonally adjusted annual rates. Consumption expenditures in August 2020 were 3.4 per cent lower than in the preceding February, despite the 2.0 percent increase in personal income over this period; expenditures in August were 1.0 per cent greater than in July, despite the 2.7 percent decrease in personal income over the subperiod.
The second chart shows the personal saving rate monthly from January 2019 through July 2020. (The saving rate is equal to the amount of personal saving divided by the amount of disposable personal income. (Disposable personal income equals personal income less personal current taxes, which are mostly income taxes).
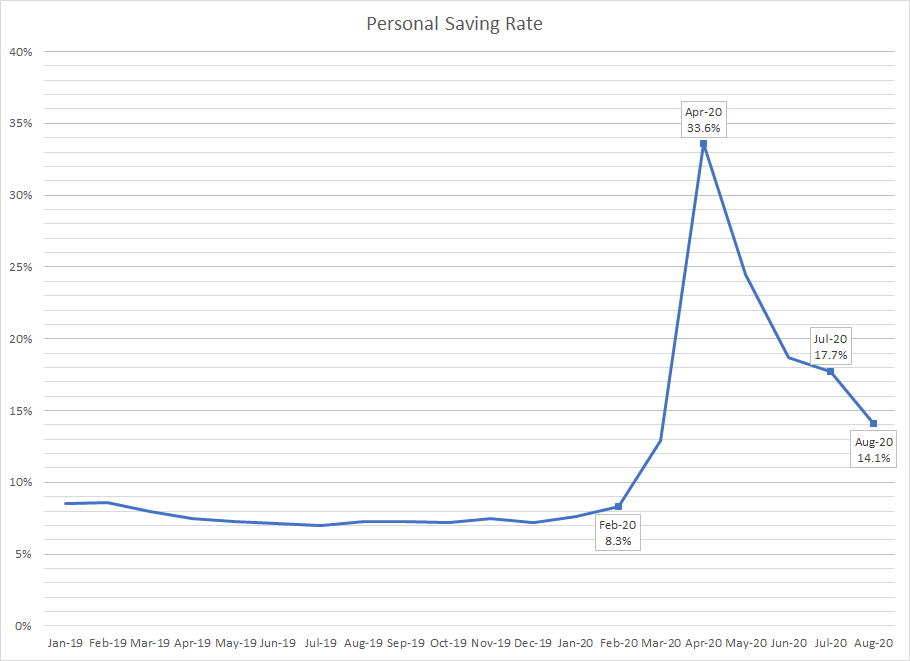
The saving rate jumped from 8.3 percent in February to an astounding 33.7 percent in April and then declined to a still quite high 14.1 percent in August. It was the 3.6 percent decline in the saving rate from July to August that allowed consumption expenditures to rise while personal income fell.
All of these numbers are preliminary estimates that will be revised as more information becomes available to the statisticians at the federal Bureau of Economic Analysis.
Categories: Economy.