2:28 pm
January 28, 2022
Here are updates of charts I have posted monthly regarding national income and consumer spending during the COVID-19 recession, including new numbers for December and revisions to numbers for prior months.
Personal Income in December was 0.3% greater than in November and 13.1% less than the peak reached in March, which was boosted by the $1.9 trillion federal relief package that was enacted that month. Consumer spending increased by $70.7 billion (seasonally adjusted annual rate) from November to December, while the saving rate increased from 7.9% to 7.2%. (The November rate has been revised up from the 6.9% reported last month.)
On the first chart, the stacked columns show estimated personal income for the U.S. as a whole, by month, from January 2019 through December 2021. The numbers are seasonally adjusted annual rates. I have broken personal income into four parts: employee compensation (wages and salaries, and supplements); unemployment insurance benefits; other government social benefits (e.g., Social Security pensions, Medicare- and Medicaid-funded healthcare services, stimulus checks); and other income (e.g., interest, dividends and profits of non-corporate business activities, including property rentals).
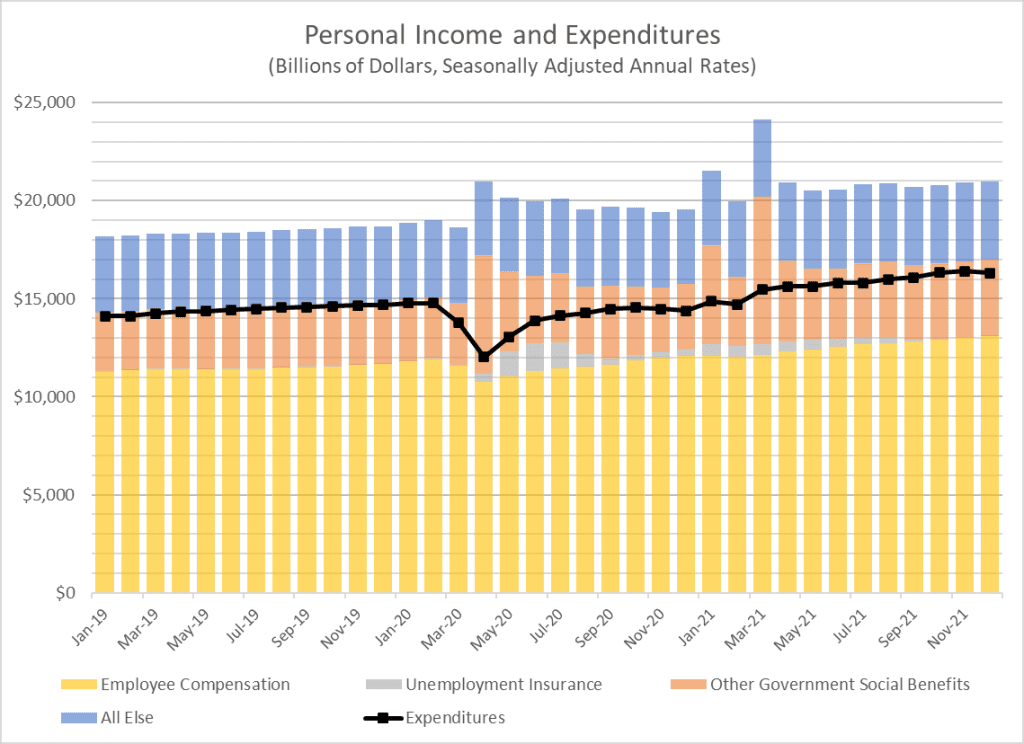
Personal income in December was $70.7 billion greater than in November: Government social benefits were down by $1.9 billion. (Within this grouping, unemployment insurance was down $6.9 billion.) Employee compensation was up by $83.3 billion. Income from all other sources was down by $10.7 billion. Overall, personal income in November was 9.8% greater than in February 2020, the last month before the pandemic began to shut down the economy. Employee compensation was 10.4 percent higher in December 2021 than in February 2020, while government social benefits were 23.6 percent higher.
Also on the first chart, the black line shows monthly personal consumption expenditures. Again, these numbers are seasonally adjusted annual rates. Consumption expenditures in December 2021 were $95.2 billion less than in November and $1,521.2 billion (10.3%) greater than in February 2020. (Adjusted for inflation, the increase from February 2020 to November 2021 was 3.2%.)
The second chart shows the personal saving rate, monthly from January 2019 through December 2021. (The saving rate is equal to the amount of personal saving divided by the amount of disposable personal income. Disposable personal income equals personal income less personal current taxes, which are mostly income taxes).
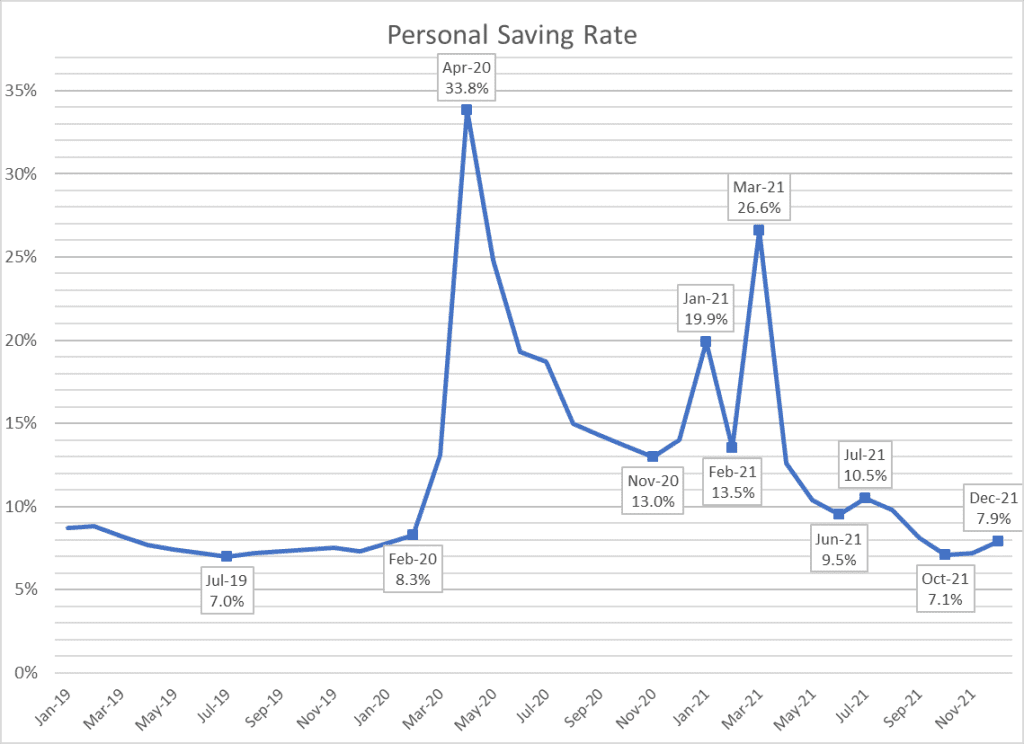
The saving rate jumped from 8.3% in February 2020 to an astounding 33.8% in April and then declined in steps to 13.0% in November. The saving rate moved up modestly in December, jumped to 19.9% in January 2021, fell back to 13.5% in February, jumped to 26.6% in March and dropped in steps to 9.5% in June. The December rate was 7.9%, up from 7.2% (revised) in November.
The third chart shows total government social benefits as a percent of personal income. (Total benefits are the sum of the unemployment insurance and other social benefit numbers shown on the first chart.)

In February 2020, prior to the pandemic, government social benefits provided 16.6% of personal income. Federal relief bills took the share to peaks of 31.0% in April 2020, 26.3% in January 2021 and 33.3% in March 2021. In December 2021, government social benefits provided 18.6% of personal income. The child tax credit, which expired at the end of December, accounts for 1.1% of the 2.0% difference between the February 2020 and December 2021 percentages.
The numbers underlying these charts are preliminary estimates that will be revised as more information becomes available to the statisticians at the federal Bureau of Economic Analysis.
The BEA monthly personal income press release is here. A BEA table showing the effects of selected federal pandemic response programs on personal income is here.
Categories: Economy.