3:45 pm
March 27, 2020
Yesterday I posted a chart showing, by sector, the number of claims for unemployment insurance filed between March 1 and March 21 divided by employment in the month of February. I will call this ratio the layoff rate. The chart below is a scatter plot with sectors’ layoff rates measured along the vertical axis and sectors’ the average weekly wages in 2018 measured along the horizontal axis. (The most recent year for which the average wage is available is 2018.) As you can see, there is a strong negative correlation between the layoff rate and the average wage. (The correlation coefficient is -0.61.) This strongly suggests that layoffs have been concentrated among lower wage workers.
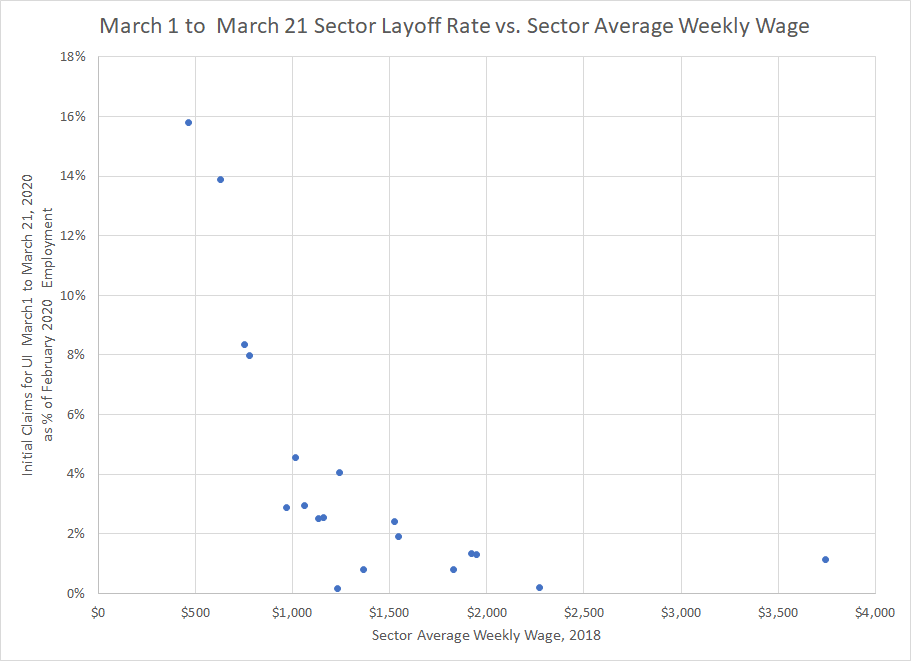
However, all the claims captured on the chart were filed before Gov. Inslee issued his “Stay Home, Stay Healthy” order requiring “every Washingtonian to stay home unless they need to pursue an essential activity” and closing “all businesses except essential businesses.” The average wages of workers laid off after Gov. Inslee’s order aught to be greater than the average wages of workers laid off prior to the order.
Here is the data used in the chart:
| Layoff | Average | |||||
| Rate | Weekly | |||||
| NAICS | Wage | |||||
| 21 | Mining and Logging | 0.8% | $1,366 | |||
| 22 | Utilities | 1.3% | $1,918 | |||
| 23 | Construction | 4.1% | $1,239 | |||
| 31-33 | Manufacturing | 2.4% | $1,526 | |||
| 42 | Wholesale Trade | 1.9% | $1,543 | |||
| 44-45 | Retail Trade | 2.5% | $1,132 | |||
| 48-49 | Transportation and Warehousing | 2.6% | $1,160 | |||
| 51 | Information | 1.1% | $3,746 | |||
| 52 | Finance and Insurance | 0.8% | $1,827 | |||
| 53 | Real Estate and Rental and Leasing | 3.0% | $1,060 | |||
| 54 | Prof., Scientific, and Tech. Services | 1.3% | $1,946 | |||
| 55 | Management of Companies | 0.2% | $2,271 | |||
| 56 | Admin. & Waste Mgmt. Services | 2.9% | $968 | |||
| 61 | Education Services | 8.4% | $750 | |||
| 62 | Health Services and Social Assistance | 4.6% | $1,013 | |||
| 71 | Arts, Entertainment and Recreation | 13.9% | $626 | |||
| 72 | Accommodation and Food Services | 15.8% | $462 | |||
| 81 | Other Services | 8.0% | $776 | |||
| 92 | Government | 0.1% | $1,228 | |||
| Total | 3.8% | $1,273 | ||||
| x | x | x |
Tags: COVID-19 , COVID-19 & the economy