1:44 pm
May 7, 2020
Here are three charts presenting initial claims for unemployment insurance in Washington state by sector for the period from March 1 to May 2.
The first chart shows the number of claims by sector.
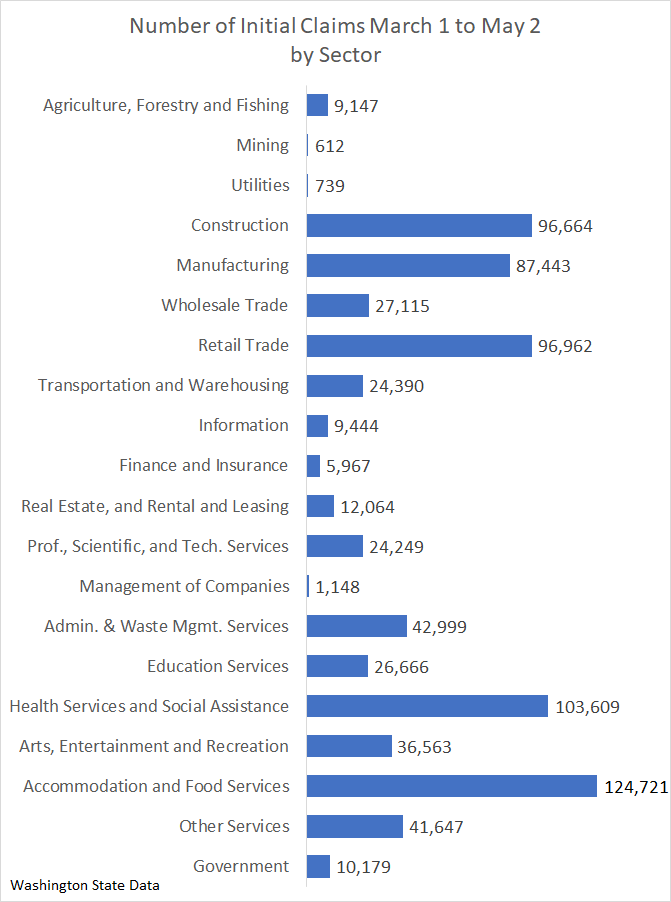
The five sectors with the greatest number of claims are, in descending order, accommodation and food services; health services and social assistance; retail trade; construction; and manufacturing. Together these five sectors accounted for nearly two-thirds of the jobs lost.
The second chart shows initial claims sector as a proportion of the sector’s employment in the month of February.
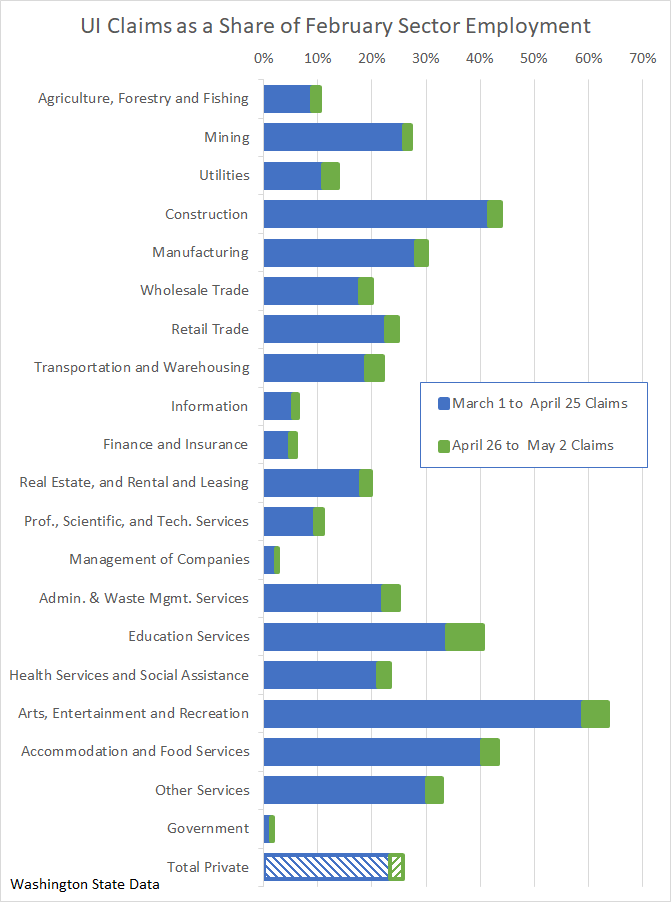
The total number of private sector claims from March 1 to May 2 is equal to 25.7 percent of private sector February employment. The arts, entertainment and recreation sector has experienced the greatest number of claims relative to February employment (63.7%), followed by the construction (43.9%) and accommodation and food services (43.3%) sectors. For the most recent week, education services is the sector with the greatest number of claims as a share of February employment.
The third chart is a scatter plot with claims as a share of February employment measured along the vertical axis and sectors’ the average weekly wages in 2018 (the most recent year for which the average wage is available) is measured along the horizontal axis.

Low wage sectors have had relatively more layoffs than high wage sectors. The correlation coefficient between claims as a share of employment and average wage is −.589.
Categories: Categories , Economy.Tags: COVID-19 , COVID-19 & the economy