9:18 am
April 3, 2020
I have updated three charts I posted last week on initial claims for unemployment insurance by industry to include data for the week of March 22 to March 28. The first shows initial claims industry as a proportion of the industry’s employment in February:
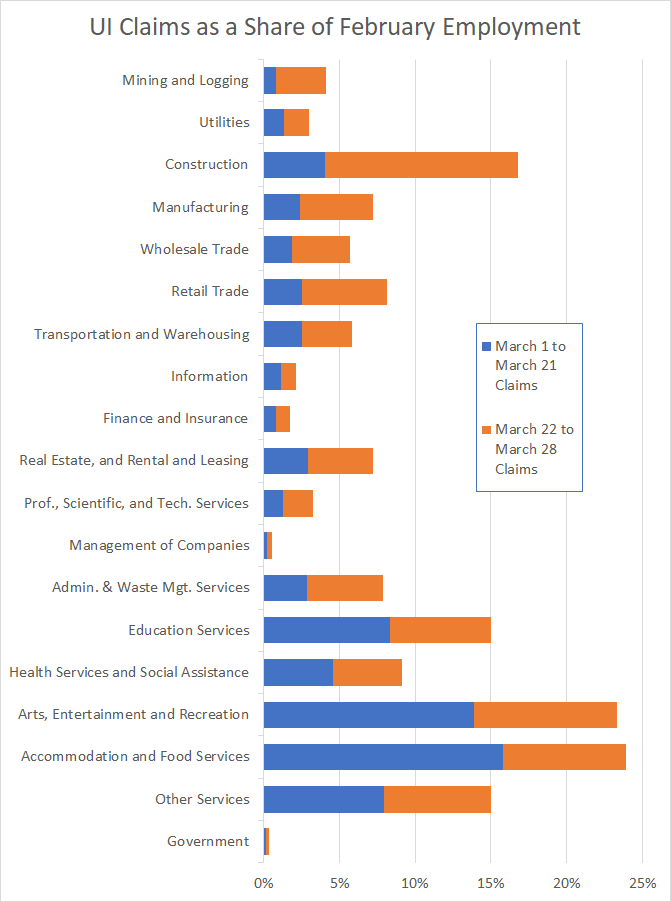
Accommodation and Food Services, and Arts, Entertainment and Recreation remain the two sectors with the greatest number of claims relative to February employment. Construction now ranks third, with the largest number of claims relative to February employment in the last week.
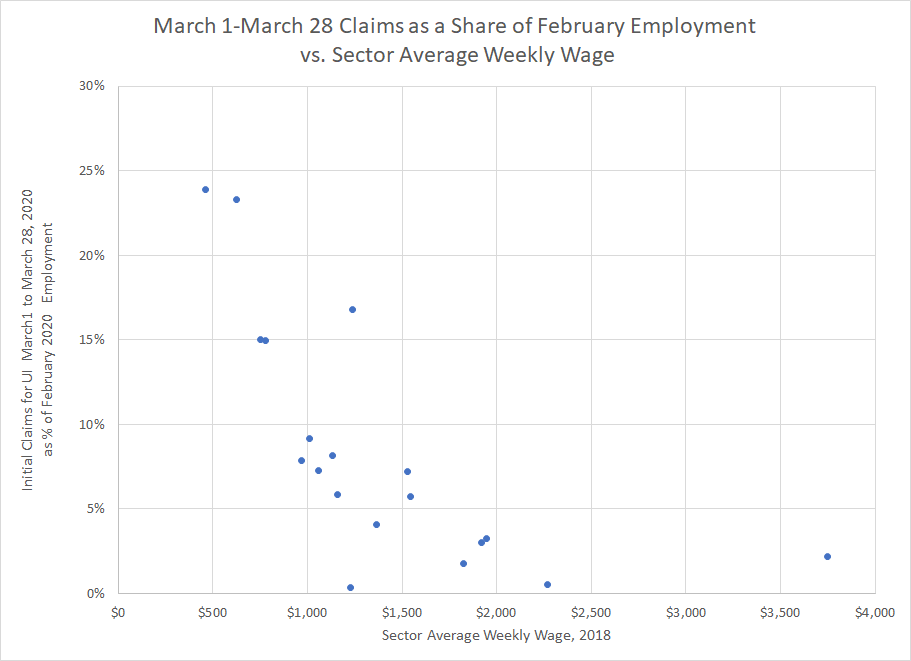
The second chart is a scatter plot with claims as a share of February employment measured along the vertical axis and sectors’ the average weekly wages in 2018 measured along the horizontal axis. (The most recent year for which the average wage is available is 2018.) Layoffs have been lower in sectors with higher average wages:
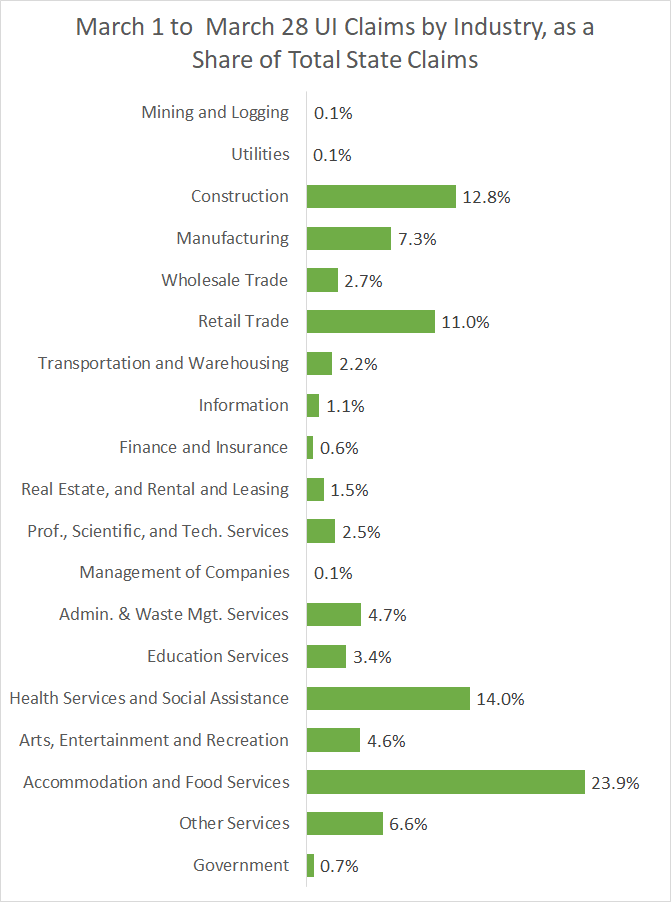
The third chart shows each industry’s claims over the March 1 to March 28 period as a share of total claims over the period:
Tags: COVID-19 , COVID-19 & the economy