3:27 pm
February 8, 2024
On January 9, the Institute on Taxation and Economic Policy (ITEP) released the 7th edition of its widely cited “Who Pays” study. Ostensibly, the good news in this report is that Washington state’s state and local tax system is no longer the most regressive in the U.S. and that the tax rate on the poorest 20% is no longer the highest. These shifts in ranking are attributed to four policy changes since the last edition was published in 2018: adoption of a graduated rate structure for the real estate excise tax, establishment of the state “excise” tax on capital gains, funding of the state’s dormant working families tax credit, and establishment of the “Jump Start” progressive payroll tax by the city of Seattle.
Due to these changes, ITEP no longer finds Washington to have the nation’s most regressive state and local tax system, Florida now can claim this distinction, while we have dropped to second. And our average tax rate for the bottom 20% of households is no longer the highest. Pennsylvania’s rate is now the highest, and Washington’s rate is only 4th highest.
Few people will be excited by such minor improvements. For example, Danny Westneat’s Seattle Times column on the new ITEP report concludes:
So we’re no longer No. 1. But the struggle continues. I was looking forward, after nearly 30 years, to a respite — to hearing no more talking points about us being America’s most regressive place. It looks like that’ll have to wait a while more.
I hope Mr. Westneat can find solace in ITEP’s estimates of the average incomes of Washington’s bottom 20%. These estimates are the “truly good news” promised in the headline to this post.
Before-tax incomes. According to ITEP’s estimates, the average before-tax income of households in the bottom 20% of the income distribution nationwide is $13,600. The average income of Washington’s bottom 20% is 37% greater, $18,600. Washington ties with Utah for the 4th highest bottom 20% average income. The three states with higher incomes than Utah and Washington are New Hampshire ($19,300), New Jersey ($19,100) and Minnesota ($19,000). The three states immediately behind Utah and Washington are Wisconsin ($17,100), Nebraska ($16,400) and Alaska ($16,400).
After-tax incomes. Using ITEP’s estimates of state and local tax rates, the average after-tax income of households in the bottom 20% of the income distribution nationwide is $12,057. For Washington state’s bottom 20%, the average after-tax income is $16,033, fifth highest among the states and 33% greater than the national figure. The four states ahead of Washington in after-tax income are Minnesota ($17,824) New Hampshire ($17,574), New Jersey ($17,426), and Utah ($16,773). The three states immediately behind Washington are Wisconsin ($15,256), Alaska ($14,971) and Nebraska ($14,555).
Accounting for taxes has only modest effects on the ranking of states according to the average income of the bottom 20% of households. The top 8 states before tax remain the top 8 after tax. Minnesota, which imposes the lowest tax rate on the bottom 20%, moves from third before-tax to first after-tax. Washington, which imposes the fourth highest tax on the bottom 20%, moves from tied for fourth before-tax to fifth after-tax. Nebraska and Alaska swap positions.
In every one of the other 42 states, the average before-tax income of the lowest 20% is less than the average after-tax income of Washington’s lowest 20%!
Looking down the Pacific coast, the situation of the bottom 20% is much worse than in Washington: In California the bottom 20%’s average after-tax income is $12,534 (22% less than Washington), while in Oregon the bottom 20%’s average after-tax income is $11,269 (30% less than Washington).
The reason that the differences between before-tax and after-tax ranks are so small is that the state-to-state percentage variations in bottom 20% incomes are much greater than state-to-state variations in bottom 20% tax rates. The highest before-tax income ($19,300, New Hampshire) is 42% greater than the average before-tax income ($13,600); the lowest before tax income ($10,000, West Virginia) is 26% lower than the average. The lowest tax rate (6.2%, Minnesota) is 5.1 percentage points lower than the average (11.3%). The highest tax rate (15.1%, Pennsylvania) is 3.8 percentage points higher than the average. Because of this, differences in income swamp differences in tax rates, and the ranking in after-tax income is largely determined by the ranking in before-tax income.
You can see this in the chart below, which plots after-tax income of the bottom 20% for the states (the vertical axis) against before-tax income (the horizontal axis). Each blue point is a state. The red line shows what after-tax income would be at the 11.3% average rate for all values of before-tax income. For each point, the vertical distance to the red line shows what would be gained or lost by moving from the state’s current tax rate to the nationwide average. Before tax income is a much more important determinant of the economic well-being of the bottom 20% than the tax rate is.
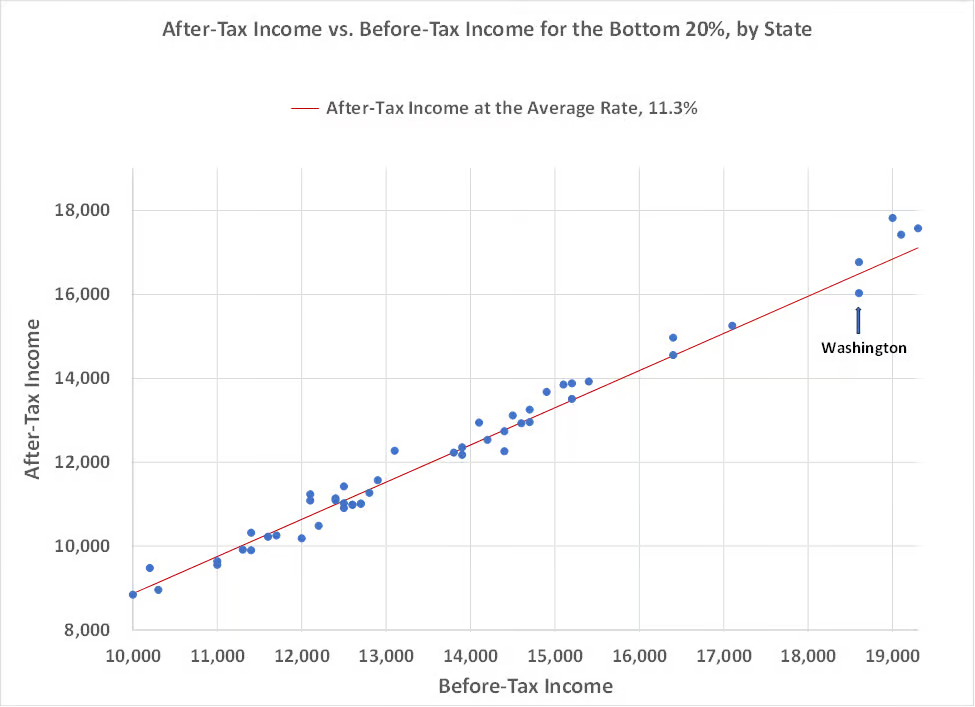
Or consider this hypothetical: For the bottom 20%, Washington’s current 4th highest before-tax income and 2nd highest tax rate result in an average after-tax income of $16.033. If instead Washington had the 4th lowest before-tax income ($11,000, tying Kentucky and Louisiana) and the 2nd lowest tax rate (6.3%, tying Vermont) the average income of Washington’s bottom 20% would be $10,305, which would rank 4th lowest.
The chart below shows the average income of each Washington quintile as a percentage of the national average for that quintile. Also noted on the chart is where the income of each Washington quintile ranks compared to incomes of that quintile in other states.
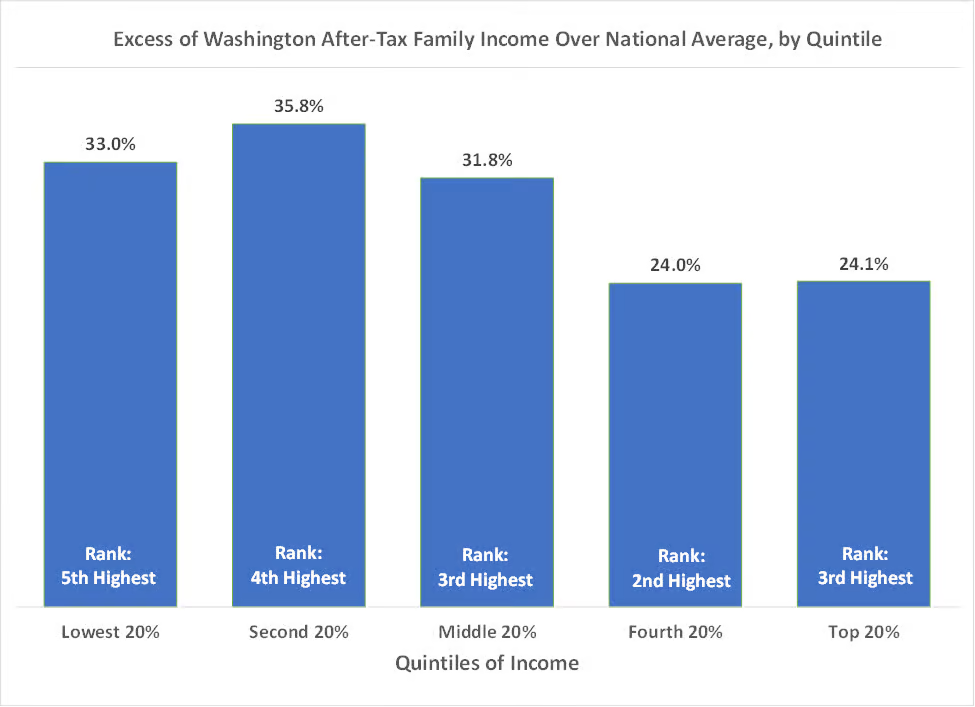
By either measure, every quintile in the state is performing very well compared to other states. While Washington’s top quintiles’ rankings are marginally better than those of the bottom quintiles, the bottom quintiles do better than the top in terms of percentages of the national averages.
Categories: Categories , Economy , Tax Policy.