1:25 pm
December 13, 2021
The labor force participation rate is the ratio between the number of people who are working or who say they are looking for work and the noninstitutional population age 16 or older. The participation rate’s behavior during and after the Covid-10 recession was unlike that during and after any other recession in the post-World War II era. The chart below shows monthly values of the participation rate from January 1970 to November 2021. (These numbers are seasonally adjusted.)

The participation rate fell from 63.3 percent in February 2000 to a low of 60.2 percent in April then rebounded back to 61.7% by August 2020. For the most recent month, November 2021, the rate was 61.8%, 1.6 percentage points less than the February 2020 value. Of this decline, 0.56 percentage point was due to changes in the age distribution of the civilian non institutional population. (For example, the share of population age 65 and older, which has a relatively low participation rate, increased from 20.5% to 21.6%.)
The second chart shows the change in participation rates for six cohorts: age 16–24, age 25–34, age 35–44, age-45-54, age 55–64 and age 65+ cohorts from February 2020 to November 2021. These numbers are not seasonally adjusted. (Seasonally adjusted rates are not available for all cohorts. Without seasonal adjustment, the overall participation rate declined by 1.5 percent from February 2020 to November 2021.)

The 65+ cohort shows the biggest reduction in rate, followed by the 35 to 44 cohort and then the 25 to 34 cohort. Participation for the 16 to 24 cohort fell by only 0.1%, and, within that cohort, the 16 to 19 group’s participation rate increased by 0.6%.
I estimate that the November 2021 labor force had 2,429,000 fewer age 20+ participants and 209,000 more age 16–19 participants than would have been the case had participation rates been equal to February 2019 values.
The next chart shows the distribution of the age 20+ labor force shortfall across age cohorts.
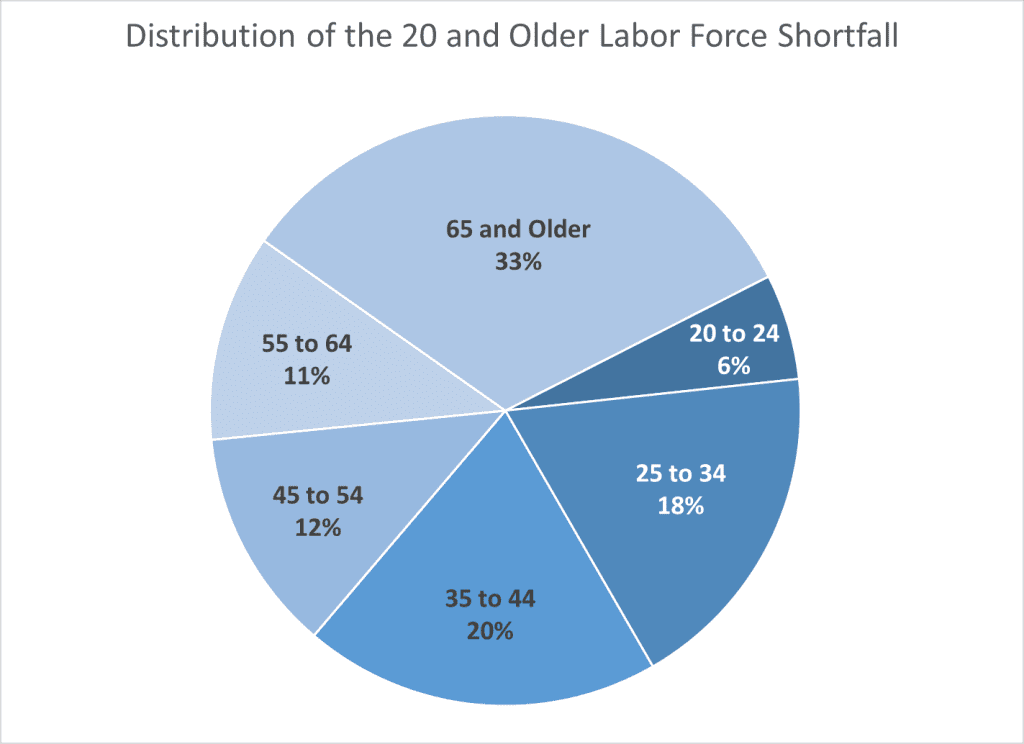
The oldest cohort, 65 and older, accounts for 33% (795,100) of the 20+ shortfall. Its total population in the month was 56.9 million. The 65+ participation rate declined from 20.8% in February 2020 to 19.3% in November 2021. At 3rd quarter 2019 participation rates, the 65+ cohort would have provided just 7 percent of the labor force.
In a November 2021 report, using data from the Census Bureau’s Current Population Survey, Richard Fry at the Pew Research Center finds that share of the 65 to 74 cohort specifically stating they were out of the labor force due to retirement increased from 64.0% in the 3rd quarter of 2019 to 66.9% in the 3rd quarter of 2021, while the retired share of 75+ cohort increased from 86.3% to 86.7%.
Fry notes that the recent experience is quite different than what happened during the Great Recession, when retirement rates generally fell.
A large part of the explanation is that older people are particularly vulnerable to Covid. The New York Times reports that about three-quarters of Americans who have died from Covid are age 65 or older.
Fry believes that household wealth is also a factor:
The financial context in which older adults are making retirement decisions during the pandemic is markedly different from the Great Recession. During that period – December 2007 to June 2009 – there was a steep decline in the value of financial assets as well as home prices. The resulting loss of wealth induced some older workers to remain in the labor force and postpone retirement. In contrast, household wealth has been rising since the onset of the pandemic. House prices have been rising in most markets. The stock market did have a sharp sell-off in March 2020 but reached new record highs by August 2020.
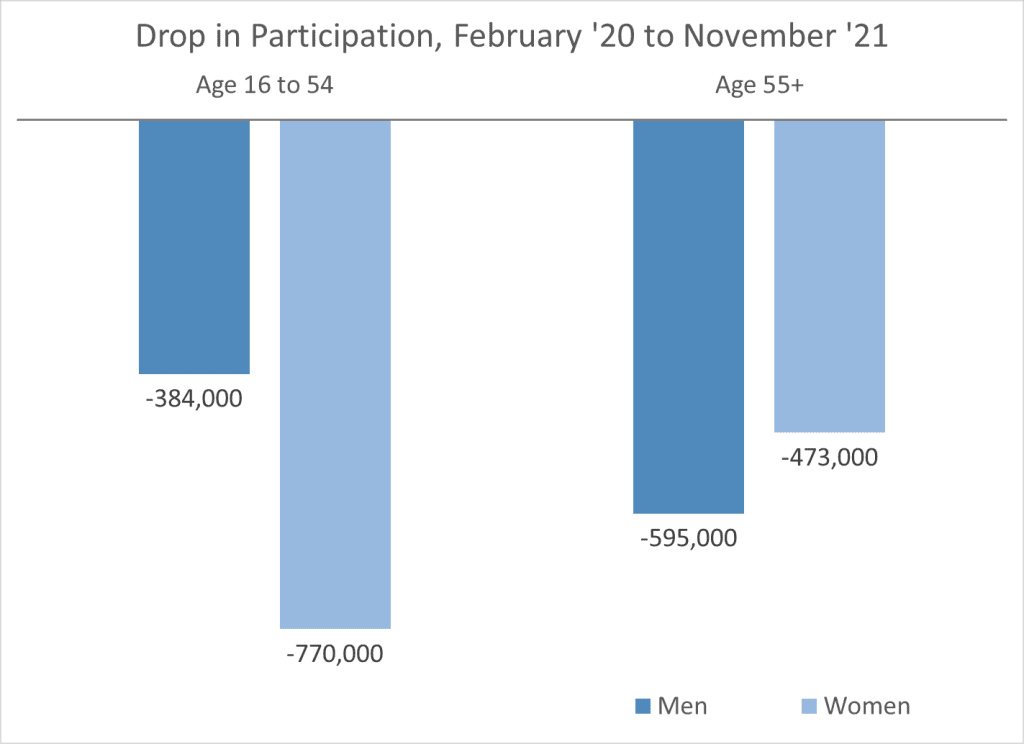
I estimate that 979,000 fewer men and 1,243,000 fewer women participated in the November 2021 labor force than would have been the case at February 2020 participation rates. As the next chart shows, the drop in women’s participation is concentrated below the age of 55.
Children are part of the explanation for this, I suspect.
The pandemic has disrupted childcare arrangements for younger kids and increased the need for direct parental involvement in the education of school-aged kids.
In an August 31 report, Pew’s Rachel Minkin compares Summer 2019 and Fall 2020 surveys in which mothers and fathers with children under age 18 were asked which of three work arrangements—working full time, working part time or not working for pay at all—would be best for them personally. For mothers, the share choosing not working at all rose by 8 percentage points from the first survey to the second survey (from 19% to 27%). For fathers, this share rose by 2 percentage points (from 7% to 9%).
The Seattle Times reports that public school enrollments in Washington state dropped by 39,000 from October 2019 to October 2020, while the number of home-schooled students grew by 19,000. From October 2020 to October 2021 public schools added just 1,000 students.
Categories: Economy.