9:30 pm
November 15, 2021
During the first 9 months of the Covid-19 downturn, April–December 2020, Washington state’s tax revenue performance ranked 7th best among the states according to data from the Urban Institute.
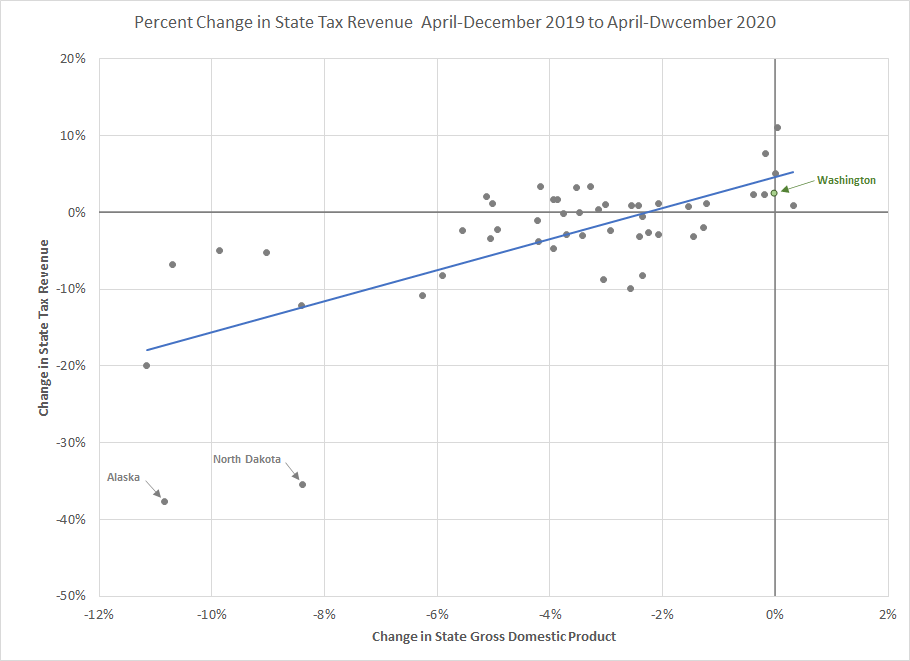
The state’s relatively strong revenue performance is directly related to its relatively strong economic performance. Over this period, the state ranked 4th in gross domestic product growth, 14th in personal income growth and 5th in wage and salary income growth. The chart below plots tax revenue growth against GDP growth. The each of two states that fall far off the trend line (Alaska and North Dakota) got more than one-half of their pre-pandemic revenues from severance taxes on the production of crude oil, the price of which fell dramatically during the pandemic.
In the period shown, tax revenue growth is more highly correlated with GDP growth than with personal income growth. (The correlation coefficient between tax revenue and GDP is 0.688, while the correlation coefficient between tax revenue and personal income is 0.422.) States get about 40% of their tax revenue from taxes on business. That portion of tax revenue is much more highly correlated to GNP than to personal income. Wage and salary income accounts for about one-half of GDP when it is measured using the income approach. GDP thus also correlates well with taxes paid by households. (The correlation between tax revenue growth and wage and salary income growth is 0.644. Wages and salaries are about one-half of personal income.)
Categories: Categories.